
How was this past December different than a typical December? How was 2020 vs 2019? Watch this month’s video to find out.
Watch here:
Or read the script here:
Hi, it’s Miia here with your monthly update.
Strong Sales and Average Home Prices
December was another month of a record number of home sales, being 64.5% higher than in December of 2019. The number of new listings was up by 66.1%, which helped to supply the demand that we see here. Normally December is a quiet month of the year for buyers and sellers, but this past December people were out buying and selling homes as if they had nothing else to do. (Yes, that was an attempt at humour.)
We also saw a strong increase in the average home price to accompany the additional activity. Prices were up by 11.2% compared to December of 2019.
For the year overall, the number of sales were up by 8.4% (remember that there was a decrease in activity in the beginning of the pandemic, and then activity picked up for the second half of the year). The overall average home price in the GTA was up by 13.5% in 2020 compared to 2019.
I’m about to show you a chart showing how the average home prices have changed over the past 13 months in Toronto, Pickering, Ajax, Whitby and Oshawa.
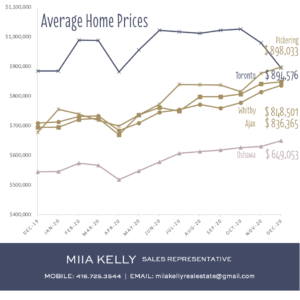
Something that stood out to me right away when I created this chart was that the average home price for Pickering actually surpassed that of Toronto! Just remember that Toronto has a lot of condo apartments compared to other regions, and the average home price in Toronto was weighted down by the decreases in values seen in the condo apartment segment.
So, even though the average home price for ALL home types was higher in Pickering last month, just remember that when you look at the statistics for specific types of homes and neighbourhoods, you may see different patterns. For example, the average price of a detached home in Toronto in December was $1,475,758 and the average price of a detached home in Pickering in December was $1,136,010 – so detached homes in Toronto, on average, were still over $300,000 more than detached homes in Pickering.
Average Home Prices by Home Type
What I’m going to show you next is a breakdown of the change in average home prices by home type compared to a year ago.
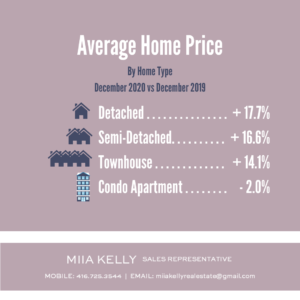
As you can see, the average home price increased in the double-digit-percentages in the detached, semi-detached and townhouse segments, whereas condo apartment average home prices dipped by 2.0%.
As I’ve said before, what you need to know if you own a condo apartment is that this dip in average home prices should just be temporary. As the pandemic gets under control, the condo apartment values should get back to a growth phase.
Pandemic Update
It seems like every time I put out an update about how the pandemic is affecting the way we practice in real estate, the government moves forward with new restrictions, rendering my post obsolete by the time I post it. At the time of recording this video, I am still allowed to list homes for sellers and show homes to buyers, but the message is clear, that we should be minimizing contact with each other by conducting as much business as we can through phone and video calls, and researching properties online and only visiting the ones of serious interest. Of course, further restrictions could be placed upon us if the risk involved is later deemed to be too high, so let’s do all that we can do to cooperate and keep transmission down.
That’s my update for this month. If you have any questions, let me know.
Bye for now.
Miia
Call/Text: 416-725-3544