
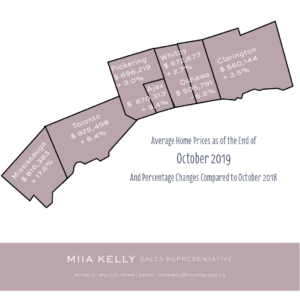
From West to East:
Mississauga
$ 816,383
+ 17.6% vs October 2018
Toronto
$ 925,498
+ 6.4% vs October 2018
Pickering
$ 696,219
+ 3.0% vs October 2018
Ajax
$ 670,313
+ 9.4% vs October 2018
Whitby
$ 672,677
+ 2.7% vs October 2018
Oshawa
$ 505,791
– 6.5% vs October 2018
Clarington
$ 560,144
+ 3.5% vs October 2018
These statistics are based on data provided by the Toronto Real Estate Board of MLS® sales for all home types within each municipality. For specific information about your neighbourhood and home type, contact me and I’ll be happy to provide you with a customized market update for you. I can also provide a free home valuation if you are wondering what your home is worth.
If you have any questions, let me know.
Miia