
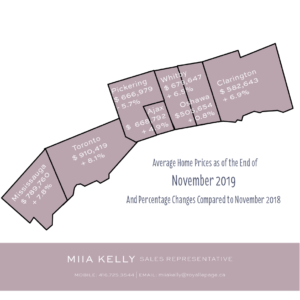
From West to East:
Mississauga: $789,760 + 7.8% vs one year prior
Toronto: $910,419 + 8.1% vs one year prior
Pickering: $666,979 – 5.7% vs one year prior
Ajax: $668,792 + 4.9% vs one year prior
Whitby: $679,647 + 6.5% vs one year prior
Oshawa: $505,654 + 0.8% vs one year prior
Clarington: $582,643 + 6.9% vs one year prior
These statistics are based on data provided by the Toronto Real Estate Board of MLS® sales for all home types within each municipality. For specific information about your neighbourhood and home type, contact me and I’ll be happy to provide you with a customized market update for you. I can also provide a free home valuation if you are wondering what your home is worth.
If you have any questions, let me know.
Miia
Average Home Price Infographic created by Miia Kelly, based on data provided by the Toronto Real Estate Board.